I probably should have written this sort of article as my very first AVR related article, to give a better understanding of my general development practices with AVR. Maybe it would make some of my code and ramblings easier to follow and understand for others. I guess it has been just too long since I started with AVR development that writing a basic user guide is difficult to get my mind into.
This is what I want to avoid with ARM development. I have a feeling there will be more focus on ARM with my personal projects in the future, so I want to create a proper base for anything that might come later on.
Moving from 8bit AVR to bare metal 32bit ARM development has been a plan for a long time. Well, okay, I have worked professionally and back in my student days with ARM before, but every time, there was a ready development environment available. I never started from scratch building the environment myself. It simply never happened. Every time I started to look into it, I got confused about where to actually start, what I'm going to need and how to actually do anything in the first place.
It somehow seems to me that the easiest option to get into ARM development is to pick one vendor and stick to that vendor only. Get their tools and accessories, and stick to that as well. I rather have a bit more generic approach, but I have the feeling that sooner or later, I'll be doing exactly that. But looking for that generic solution seemed more of a burden.
Well, one day I didn't let loose and decided I wouldn't stop trying until I had flashed some hello world blinky to one of my dusty ARM boards - so here's my story about that. And then some.
But just to make sure there's no confusion, the "on Linux" part in the title refers to Linux as development environment. I won't be running Linux on a Cortex-M. Also, I'm still at the state of unknown unknowns regarding ARM development. It's all still pretty fresh to me and I honestly don't even know what I don't know about this subject.
Choosing a development board
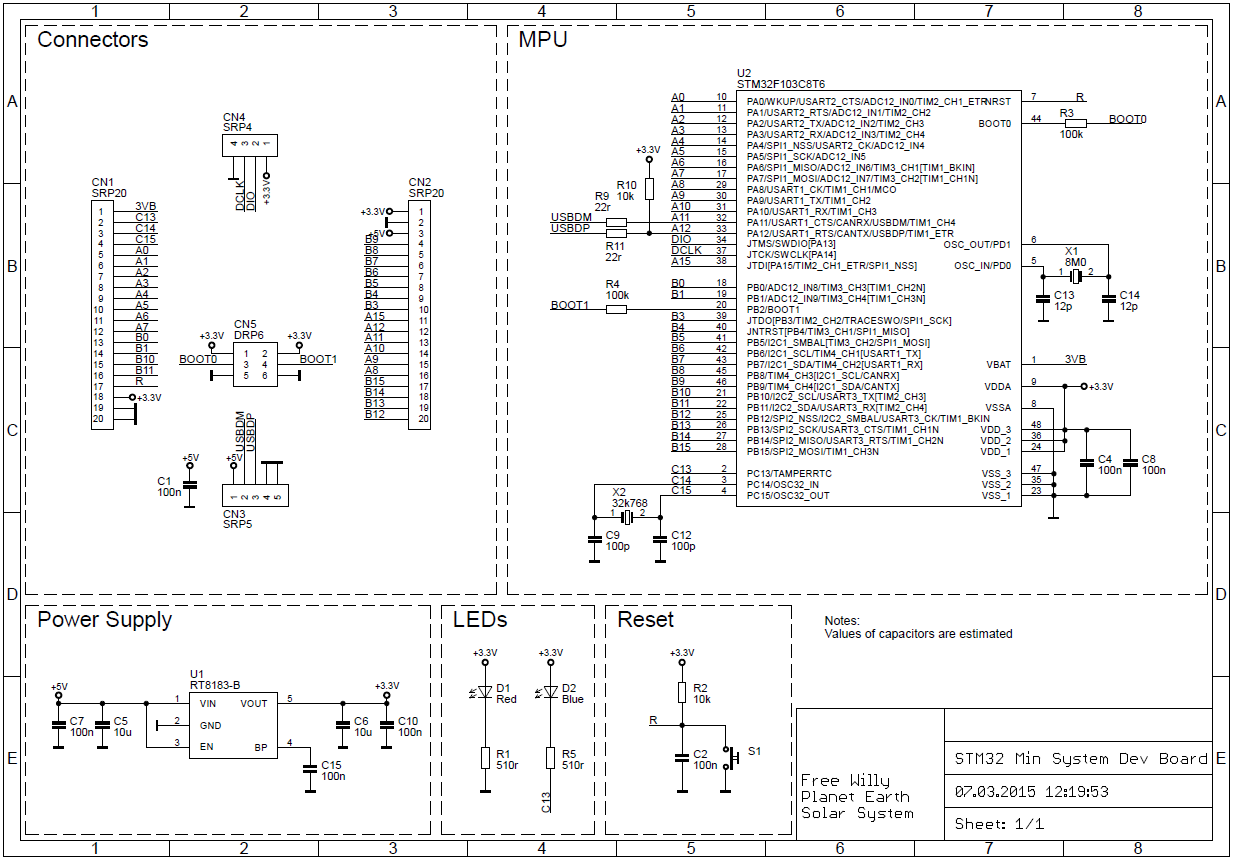
Over the years, I have (quite randomly) acquired a few development boards from all sorts of vendors. As a very first start, I gathered them all together and tried to communicate with either one of them via JTAG. One STM32F103 based no-frills board I got from Watterott in Germany kinda worked the best for me, but unfortunately it's not very breadboard friendly. But turns out you'll get a very similar alternative for around half the price from China - same chip family with less flash but more pins. You'll probably find it as "Mini STM32", "Blue Pill" / "Red Pill" (depending on the PCB color) or just the cheapest ARM board available. For pinout, schematic and other information, check Zoltan Hudak's blog article at mbed.

From here on forward, it's assumed the cheapo China ARM board will be used. In theory, any other STM32F103 based board might do as well, but chances are there the hardware is not identical (e.g. if blinking a LED later on, the board's LED - if it has any - might be connected to a different microcontroller pin).
Connecting the board
Unlike AVR which uses SPI, or ESP8266 which uses UART, you will most likely need a JTAG or SWD debugger to eventually flash the firmware to your ARM board and optionally debug your program. In case of the previously mentioned cheap STM32F103 board, the choice is SWD.
One option is to get a very generic debugger that supports both JTAG and SWD, like the ARM-USB-OCD-H with matching SWD adapter. A more higher end option (at least based on the price tag - although there is a very affordable non-commercial option for educational purposes available) can be found from Segger. STMicroelectronics has the ST-Link, which you can get as cheap SWD-only clone from China in a small USB stick package. Coincidentally, the cheap clone will work well enough with the cheap STM32F103 board.

The actual communication will happen via OpenOCD which supports all JTAG/SWD debuggers mentioned so far (the Segger one is unconfirmed, but there's a config script for it, so it should work just fine). I personally have the Olimex and a ST-Link clone, so naturally I will use those.
Getting the software ready
Apart from OpenOCD, we will look into libopencm3 as general support library for ARM Cortex-M3, and use an ARM toolchain for compiling, linking and all that, as well as GDB for debugging. GDB isn't fully necessary, but it's really nice to have in my opinion, so I recommend installing that along the way (lots of fiddling around with the hardware later is done with GDB).
ARM Toolchain
Your distribution's package manager should have all you need: GCC, binutils and GDB. Again, GDB is optional, but thanks to JTAG and OpenOCD, we have an out-of-the-box debug interface readily available through GDB.
If you have Ubuntu, you can install it all via
sudo apt-get install gcc-arm-none-eabi binutils-arm-none-eabi gdb-arm-none-eabi
The package names should be very similar if not identical on other Linux systems. If you're using the kind of distribution that doesn't have an ARM toolchain available from the package manager, you probably know how to get one.
OpenOCD
Again, OpenOCD is probably available from your Linux system's package manager. However, the available version might not be the latest one, which means in best case it's around 2 years old. It might not be a problem, the board and debuggers used in this article were already supported in the previous version (confirmed with 0.9.0, unknown for older versions). Either way, check from here if you want the latest version.
Once installed, a few notes on how OpenOCD operates. OpenOCD is mainly a bridge between the microcontroller attached via JTAG/SWD and the actual debug interface. This can be GDB, a simple telnet connection or some Tcl RPC API (never tried that one).
OpenOCD comes with a set of configuration files (Tcl scripts, actually) for both the JTAG debug interface, and the target board / microcontroller. The location of those files depends on where either you or your system's package manager installed them to. One option could be /usr/share/openocd/scripts/. If you build OpenOCD manually and without installing it system-wide, the directory is called tcl instead of scriptsin the OpenOCD source tree.
There are other files as well, but for this article, only the interface and target directories inside the scripts (or tcl) directory are of interest. Have a look around in those directories and look into some files to get some idea what's going on.
To set up OpenOCD properly, we'll need to run it with the matching configuration for our hardware setup:
target/stm32f1x.cfgfor the STM32F103 based boardinterface/stlink-v2.cfgif using the ST-Link cloneinterface/ftdi/olimex-arm-usb-ocd-h.cfgandinterface/ftdi/olimex-arm-jtag-swd.cfgif using the Olimex JTAG debugger + SWD adapter
So to actually execute OpenOCD, you have to add each file with -f parameter:
openocd -f /path/to/scripts/interface/stlink-v2.cfg -f /path/to/scripts/target/stm32f1x.cfg
when using the ST-Link clone, and
openocd -f /path/to/scripts/interface/ftdi/olimex-arm-usb-ocd-h.cfg -f /path/to/scripts/interface/ftdi/olimex-arm-jtag-swd.cfg -f /path/to/scripts/target/stm32f1x.cfg
when using the Olimex ARM-USB-OCD-H + SWD adapter.
Calling either of it at this point will fail - unless you actually connected the board to the JTAG debugger and powered it up. I'll come back to that later, for now, I'll finish the software installation part.
libopencm3
Check the libopencm3 git repository for installation instructions. I haven't looked into standalone setup yet, for now I just cloned it into /opt/ and thought I can just point the GCC flags to it later.
An easier starting point for now will be the libopencm3-examples repository, which ships the library itself as submodule and comes with basic sample code for a variety of ARM devices. However, not for our cheap China board (unless I missed it). This is actually a good thing, as it gives us the opportunity to write our own example for it - based on an example for a similar device.
But first, getting the example code, the libopencm3 submodule, and setting it all up.
$ cd /path/to/wherever
$ git clone https://github.com/libopencm3/libopencm3-examples.git
Cloning into 'libopencm3-examples'...
...
$ cd libopencm3-examples
$ git submodule init
Submodule 'libopencm3' (https://github.com/libopencm3/libopencm3.git) registered for path 'libopencm3'
$ git submodule update
Cloning into 'libopencm3'...
...
$ make
...
$
Hopefully it all went through without any errors, and the library and examples are all built. Feel free to have a look around the directories and example source code. We'll have a look at examples/stm32/f1/ in a little while, but first, we should make sure the hardware and JTAG communication actually works
Hooking up JTAG
A little bit earlier, running OpenOCD failed, which was expected as it requires to actually communicate with the hardware to run successfully. So time to get that done.
Since our board uses SWD, it's only four wires to connect, Vcc, GND, SWD clock and SWD data, which are conveniently routed to its own pin headers. For the ST-Link clone, it's easy to find those four pins as the printout is on the case itself. Only confusing part might be, which way to map the printout to the actual pins. In my case, there was an arrow on the connector pointing to pin number 1, but just in case, here's a picture:

| Pin | Color | Signal | Description |
|---|---|---|---|
| 2 | white | SWCLK |
SWD Clock |
| 4 | green | SWDIO |
SWD Data |
| 6 | black | GND |
Ground |
| 8 | red | 3.3V |
Vcc, this will also act as supply voltage for the board itself |
For the Olimex JTAG/SWD adapter it will require a look at the adapter's schematic to find the correct pins. And even then it's not that clear on first sight, so let me save you some trouble:

| Pin | Color | Signal | Description |
|---|---|---|---|
| 1 | red | VCC |
Supply voltage sense, this is NOT a power supply pin! |
| 7 | green | TMS_SWDIO |
SWD Data |
| 9 | white | TCK |
SWD Clock |
| 4 | black | GND |
Ground (also all other even numbered pins except pin 2) |
As you can see from both tables, the Vcc connection will act different on the programmers. While the ST-Link can provide both 3.3V and 5V voltages, the Olimex SWD adapter provides only 5V on pin 19 (see schematic). Our board requires 3.3V (as the pin Vcc is connected to states), so the ST-Link can directly power it through the 3.3V pin. When using the Olimex programmer, it's probably easiest to just power the board through its USB connector.
However, the board's 3.3V pin still needs to be connected to the Olimex programmer's pin 1 (VCC) as it is acting as a power detection input. Without this connection, OpenOCD won't be able to detect the board.
Hello Board
Finally, we should be able to establish a connection via OpenOCD to the board. I'll save you the scrolling and will just copy the OpenOCD command lines again. This time, it's assumed you're in the OpenOCD scripts directory (or tcl directory, see above), so the parameters are relative to that directory (easier to copy and paste I guess)
ST-Link:
openocd -f ./interface/stlink-v2.cfg -f ./target/stm32f1x.cfg
Olimex ARM-USB-OCD-H + SWD adater:
openocd -f ./interface/ftdi/olimex-arm-usb-ocd-h.cfg -f ./interface/ftdi/olimex-arm-jtag-swd.cfg -f ./target/stm32f1x.cfg
Remember to power up the board through USB if you're using the Olimex programmer. With the ST-Link, you can also power the board through USB, but in that case it might be better to remove the 3.3V connection between the programmer and the board. Once powered up, the board's default program should make the red LED flash.
If everything is set up properly, calling OpenOCD will give you some debug and info output - just like before as it failed, but this time it should not return back to the shell but keep running in the foreground. The output will look something like this:
Open On-Chip Debugger 0.10.0
Licensed under GNU GPL v2
For bug reports, read
    http://openocd.org/doc/doxygen/bugs.html
Info : FTDI SWD mode enabled
adapter speed: 1000 kHz
adapter_nsrst_delay: 100
none separate
cortex_m reset_config sysresetreq
Info : clock speed 1000 kHz
Info : SWD DPIDR 0x1ba01477
Info : stm32f1x.cpu: hardware has 6 breakpoints, 4 watchpoints
Well, now what?
Typing anything into the running OpenOCD instance doesn't seem to have any effect. Some time earlier I wrote how OpenOCD is basically just a bridge, so in that sense, it doesn't provide a direct way to interact with it. Instead, it provides three network daemons on different ports:
- GDB server on port 3333
- telnet server on port 4444
- Tcl server on port 6666
To make sure that's the case, netstat can confirm this, at least the ports:
$ sudo netstat -nltp |grep openocd
tcp        0      0 0.0.0.0:6666            0.0.0.0:*               LISTEN      21001/openocd
tcp        0      0 0.0.0.0:4444            0.0.0.0:*               LISTEN      21001/openocd
tcp        0      0 0.0.0.0:3333            0.0.0.0:*               LISTEN      21001/openocd
As you can see, the listening address is 0.0.0.0, i.e. "any address available on this machine", which means the OpenOCD instance is accessible through the network.
If you prefer to keep the connections limited to localhost, you would need to add "bindto 127.0.0.1" to OpenOCD. You can do this with the openocd -c <cmd> parameter, or then add it to your own config script you add with the -f paremeter.
openocd -c "bindto 127.0.0.1" -f ./interface/stlink-v2.cfg -f ./target/stm32f1x.cfg
See also the OpenOCD user manual's "General Commands". To change the ports, have a look at the Server Configuration chapter. And for anything else, well, the whole manual.
Where was I...
Yes, by default, there's a telnet server running on port 4444, and a GDB server on port 3333. I'm still going to ignore the Tcl interface, and will do so for the rest of this writing.
Let's start with telnet. Open a second terminal and connect to the telnet server:
$ telnet localhost 4444
Trying 127.0.0.1...
Connected to localhost.
Escape character is '^]'.
Open On-Chip Debugger
>
In the terminal your OpenOCD is running, you should see something like this:
Info : accepting 'telnet' connection on tcp/4444
Great. Let's dump the register content with the reg command for no obvious reason, just to have some basic interaction with the hardware. But before we can do that, we need to halt the processor first, using the halt command.
> halt
target halted due to debug-request, current mode: Thread
xPSR: 0x21000000 pc: 0x08000198 msp: 0x20000400
This already shows some of the registers' content, namely the Program Status Register (xPSR), Program Counter (PC) and the Stack Pointer (MSP). Now, let's get the rest of them:
> reg
===== arm v7m registers
(0) r0 (/32): 0x00006252
(1) r1 (/32): 0x422201B4
(2) r2 (/32): 0x40011000
(3) r3 (/32): 0x10032000
(4) r4 (/32): 0x080004CC
(5) r5 (/32): 0x080004CC
(6) r6 (/32): 0x8AA71453
(7) r7 (/32): 0x395B32E8
(8) r8 (/32): 0xFF7FEF97
(9) r9 (/32): 0xFFFFBFFD
(10) r10 (/32): 0xB666D97B
(11) r11 (/32): 0xB63648FC
(12) r12 (/32): 0x00002000
(13) sp (/32): 0x20000400
(14) lr (/32): 0x08000493
(15) pc (/32): 0x08000198
(16) xPSR (/32): 0x21000000
(17) msp (/32): 0x20000400
(18) psp (/32): 0xB6FFA7F0
...
..and so on. Needless to say, your values may vary. And you should see the same response from the telnet session in the OpenOCD instance terminal.
Play around if you want to, check the help command as a starting point and wade through the OpenOCD user manual. For the purpose of this article, I'll be moving on to GDB now. Let's reset the processor and quit the telnet session
> reset
> ^]
telnet> quit
Connection closed.
$
That ^] means pressing CTRL + ] to enter the telnet command line.
Connecting with GDB
You can use GDB from any architecture you want, but to get the best support - and also the correct registers and everything, you're better off using the ARM toolchain's version of GDB. In our case, arm-none-eabi-gdb.
$ arm-none-eabi-gdb
GNU gdb (7.10-1ubuntu3+9) 7.10
Copyright (C) 2015 Free Software Foundation, Inc.
...
Type "apropos word" to search for commands related to "word".
(gdb)
First, we need to connect to OpenOCD:
(gdb) target remote localhost:3333
Remote debugging using localhost:3333
0x00000000 in ?? ()
(gdb)
Since we don't have any information on what's running on the board, we cannot do much useful with GDB at this point. Well, it clearly blinks the LED, and sure, we could analyze the program flow, but I'll keep that for later, when we're flashing our own blinking LED program. For now, let's just do the same we did in the telnet session: halt the processor and dump the register content.
(gdb) monitor reset halt
target halted due to debug-request, current mode: Thread
xPSR: 0x01000000 pc: 0x08000144 msp: 0x20000400
(gdb) continue
Continuing.
^C
Program received signal SIGINT, Interrupt.
0x08000198 in ?? ()
(gdb) info registers
r0             0xa63b3    680883
r1             0x42220000    1109524480
r2             0x40011000    1073811456
r3             0x10032000    268640256
r4             0x80004cc    134218956
r5             0x80004cc    134218956
r6             0x9aa7144b    -1700326325
r7             0x395b33e8    962278376
r8             0xff7fef97    -8392809
r9             0xffffbffd    -16387
r10            0xf6e6d97f    -152643201
r11            0xb63648fc    -1237956356
r12            0x2000    8192
sp             0x20000400    0x20000400
lr             0x80004ad    134218925
pc             0x8000198    0x8000198
xPSR           0x21000000    553648128
(gdb)
Also, since we're just running a random program here, we don't have any debug information or symbol table or anything at all available. It also seems there is no register data available without continuing the program first, and then interrupt it. There might be a more elegant way to do this, but this one will have to do now.
If you're used to GDB, you definitely want to continue using it. If you're not familiar with GDB, I'd say you should get familiar with it. Maybe start with OpenOCD's user manual entry on GDB and continue with any tutorial you'll find.
On a side note, GDB commands can be heavily abbreviated. For example, when I wrote "info registers", "i r" would do the same. When I wrote "continue", "cont" or simply "c" would work as well. For the beginning, using the full commands is probably less confusing, but just for you to know.
Write me something
Now that the OpenOCD, JTAG programmer and other general basics have been at least somewhat covered, it's time to continue with the actual programming. Please note, this article won't provide much more deeper insight into any of these subjects. These basics alone result already in a way too long article that anyone would ever want to read, going further into details just seems like a waste of time. My intention is to have a basic all-round article with a few extra information here and there. I hope I can give enough pointers for you to know, what other information you may want to look for. The internet should provide plenty of resources on more focused subjects within these areas.
Moving on.
As I mentioned while installing the libopencm3 examples, our cheap China board won't have out-of-the-box support for any of the libopencm3 examples. For the purpose of education, I'll see this as a good thing. All I really want to do in this article, is to get the on-board LED blinking. The Hello World of microcontroller programming - toggling one simple pin.
Some of the supported boards in the libopencm3 examples have a project called miniblink that is doing exactly that. Let's find them.
$ cd /path/to/wherever/libopencm3-examples
$ cd examples/stm32/f1
$ find . -type d -name miniblink
./waveshare-open103r/miniblink
./stm32-h103/miniblink
./stm32vl-discovery/miniblink
./stm32-maple/miniblink
One of those four boards could provide us the base for our own board. I'll be choosing the stm32vl-discovery board for no real reason (maybe nostalgia, this was my first ARM board as far as I remember).
Besides the miniblink code, we'll be needing a linker script. The ones in the examples only define RAM and ROM sizes, everything else is handled by a generic STM32F1 linker script. Let's use the bluepill name for the cheap China board, and copy the required files into a new directory inside the stm32/f1/ example directory.
$ mkdir bluepill
$ cp stm32vl-discovery/stm32vl-discovery.ld bluepill/bluepill.ld
$ mkdir bluepill/miniblink
$ cp stm32vl-discovery/miniblink/Makefile bluepill/miniblink/
$ cp stm32vl-discovery/miniblink/miniblink.c bluepill/miniblink/
$ cd bluepill
Let's start by adjusting the linker script. Open bluepill.ld in your editor and adjust the MEMORY definition to match the STM32F103C8T6's 64kB of flash and 20kB of RAM.
MEMORY
{
    rom (rx)  : ORIGIN = 0x08000000, LENGTH = 64K
    ram (rwx) : ORIGIN = 0x20000000, LENGTH = 20K
}
The origin addresses will remain the same. Feel free to verify this by checking the device's memory map in the datasheet, where you will find SRAM section at address 0x20000000 and Flash Memory at address 0x08000000.
Next, we'll look into the minibink/Makefile. Chances are we have to adjust a path or name to match our bluepill name. And yes, turns out it's the case for the linker script variable LDSCRIPT:
LDSCRIPT = ../bluepill.ld
At this point, we can have a test run to see if everything is set up correct and, as a start, compilation will succeed. By default, libopencm3 builds very quietly, which means you won't get any output. Use the V=1 parameter for make (or add it to your Makefile) to get a more verbose compilation process.
$ make V=1
Using ../../../../../libopencm3/ path to library
arm-none-eabi-gcc -Os -std=c99 -g -mthumb -mcpu=cortex-m3 -msoft-float -mfix-cortex-m3-ldrd -Wextra -Wshadow -Wimplicit-function-declaration -Wredundant-decls -Wmissing-prototypes -Wstrict-prototypes -fno-common -ffunction-sections -fdata-sections  -MD -Wall -Wundef -DSTM32F1 -I../../../../../libopencm3//include  -o miniblink.o -c miniblink.c
arm-none-eabi-gcc --static -nostartfiles -T../bluepill.ld -mthumb -mcpu=cortex-m3 -msoft-float -mfix-cortex-m3-ldrd -Wl,-Map=miniblink.map -Wl,--gc-sections -L../../../../../libopencm3//lib miniblink.o -lopencm3_stm32f1 -Wl,--start-group -lc -lgcc -lnosys -Wl,--end-group -o miniblink.elf
Great, looks like all is set up. Unfortunately we cannot flash this to our board and get the desired result. Time to get the code right.
Finally, some actual code!
Open the bluepill/miniblink/miniblink.c in your editor and have a look at it. As one would expect, pretty much all there is to do to get the LED blink is to initially set up the port as output, have a clock, and then periodically toggle the pin's state for all eternity.
I like how the examples have comments of how to do the same thing by accessing the registers directly. Well yes, this shows how so much more convenient libopencm3 is in comparison, but it's also a great starting point to get down to that level. I should probably do that so this article can deserve the "bare metal" part in the title, this just seems high-level stuff now. Well.. I leave this as exercise to the reader.
Regardless of the general comments in the code, it appears the STM32 Discovery board has its LED on pin PA_1, i.e. port A (GPIOA) pin 1 (GPIO1). A look at our board (or the schematic) will show, it has the on-board LED connected to pin PC_13. So all there is to do, is adjusting those values.
For readability, I'll omit the original comments from the code now.
#include <libopencm3/stm32/rcc.h>
#include <libopencm3/stm32/gpio.h>

static void gpio_setup(void)
{
    rcc_periph_clock_enable(RCC_GPIOC); /* was RCC_GPIOA */
    gpio_set_mode(GPIOC, GPIO_MODE_OUTPUT_2_MHZ,
              GPIO_CNF_OUTPUT_PUSHPULL, GPIO13);
}

int main(void)
{
    int i;
    gpio_setup();

    while (1) {
        gpio_toggle(GPIOC, GPIO13); /* LED on/off */
        for (i = 0; i < 200000; i++)    /* Wait a bit. */
            __asm__("nop");
    }

    return 0;
}
Besides all the port and pin adjustments, I also reduced the loop counter value from 800000 to 200000 which will make it blink faster. I am very sure, the board's original program is the exact same original miniblink example, so making it blink faster will instantly show if our own program was really uploaded to the board.
Speaking of which, let's compile this and do exactly that: flash it to the board. The libopencm3 examples work directly with OpenOCD, so there isn't anything to set up for this step. Except, well, having your OpenOCD instance still running.
$ make
$ make flash
...
** Verified OK **
** Resetting Target **
$
Your board's LED should now blink faster. If so, congratulations, you just wrote and flashed your first ARM program. Feel free to adjust the loop counter next and flash the new program again. If your setup is like mine, chances are it will fail to actually flash it, and timeout instead. Trying a second time to flash should succeed in that case. I didn't look into the reason for that yet, but wanted to mention it, so you won't have to panic if flashing suddenly doesn't work anymore.
Another look on the inside
Okay, it's been a long road, and we finally arrived somewhere with a result. You can be happy with that and call it a day. But now that we actually have the binary and all, I would like to get one last time into GDB. This time, calling it with our freshly compiled miniblink.elf file. Note, if anything feels like it's misbehaving - not being able to stop or continue execution, easiest solution might be to quite GDB, abort OpenOCD with CTRL+C, and maybe also power off the device and start over.
$ arm-none-eabi-gdb miniblink.elf
...
Reading symbols from miniblink.elf...done.
(gdb) target remote localhost:3333
Remote debugging using localhost:3333
0x00000000 in ?? ()
(gdb) c
Continuing.
WARNING! The target is already running. All changes GDB did to registers will be discarded! Waiting for target to halt.
^C
Program received signal SIGINT, Interrupt.
0x08000178 in main () at miniblink.c:66
66                      for (i = 0; i < 200000; i++)    /* Wait a bit. */
(gdb)
Yes, we now have our source code included in GDB. Want to see what the current value for i is?
(gdb) print i
$1 = 138927
There you go, it's 138927.
Stepping one instruction at a time through the program for a while and looking again at the value of i:
(gdb) stepi
67                              __asm__("nop");
(gdb)
66                      for (i = 0; i < 200000; i++)    /* Wait a bit. */
(gdb)
0x08000178      66                      for (i = 0; i < 200000; i++)    /* Wait a bit. */
(gdb)
67                              __asm__("nop");
(gdb)
66                      for (i = 0; i < 200000; i++)    /* Wait a bit. */
(gdb)
0x08000178      66                      for (i = 0; i < 200000; i++)    /* Wait a bit. */
(gdb)
67                              __asm__("nop");
(gdb) print i
$2 = 138929
(gdb)
To shorten it, si will do the same. But if you simply press Enter without any new instruction, GDB will always use the last command. Also note that GDB creates new internal variables when you print a symbol. This means, print $1 will display 138927, the value i had first time it was looked into. Again, your values most certainly will differ.
Now, in theory we should be able to not only read, but also assign a value to the variable. Unfortunately trying so with a variable not declared volatile will not work. Not sure if this is ARM related or because it's remote debugging or something completely different.
But we can modify register content. Let's see if our counter variable i is stored in one
(gdb) info reg
r0             0x40011000       1073811456
r1             0x20000000       536870912
r2             0x2000   8192
r3             0xee8f   61071
r4             0x80002a8        134218408
r5             0xdb7ffef3       -612368653
r6             0x8aa71c43       -1968759741
r7             0x395b33e8       962278376
r8             0xff7fef97       -8392809
r9             0xffffbffd       -16387
r10            0xf666d97b       -161031813
r11            0xb63648fc       -1237956356
r12            0x2000   8192
sp             0x20004ff8       0x20004ff8
lr             0x8000173        134218099
pc             0x8000174        0x8000174 <main+36>
xPSR           0x21000000       553648128
(gdb)
This shows the register names, the hexadecimal value and the decimal value. None of these values are 138929 though. But let's see what happens if we have another cycle or two with single step instructions and check again.
(gdb) si
66                      for (i = 0; i < 200000; i++)    /* Wait a bit. */
(gdb)
0x08000178      66                      for (i = 0; i < 200000; i++)    /* Wait a bit. */
(gdb)
67                              __asm__("nop");
(gdb)
66                      for (i = 0; i < 200000; i++)    /* Wait a bit. */
(gdb)
0x08000178      66                      for (i = 0; i < 200000; i++)    /* Wait a bit. */
(gdb)
67                              __asm__("nop");
(gdb) print i
$4 = 138931
(gdb) info reg
r0             0x40011000       1073811456
r1             0x20000000       536870912
r2             0x2000   8192
r3             0xee8d   61069
r4             0x80002a8        134218408
r5             0xdb7ffef3       -612368653
r6             0x8aa71c43       -1968759741
r7             0x395b33e8       962278376
r8             0xff7fef97       -8392809
r9             0xffffbffd       -16387
r10            0xf666d97b       -161031813
r11            0xb63648fc       -1237956356
r12            0x2000   8192
sp             0x20004ff8       0x20004ff8
lr             0x8000173        134218099
pc             0x8000174        0x8000174 <main+36>
xPSR           0x21000000       553648128
Well, we incremented i two more times, and if we compare the register values, register r3 was decreased by two. And if we add i and r3, we actually end up with 200000, our loop counter value. It simply counts in the other direction to eventually compare with zero - which makes sense, processors usually have an instruction to compare against zero.
One final trick
The CPU is currently halted and (in my case) the LED is on. The LED might be off in your case, that doesn't matter. Let's toggle it from inside GDB.
So we found out we cannot set i directly, but register r3 is used to store its value. Once the register value is zero, the loop will end. Right now, this would take anoter 61069 cycles. Let's speed that up by setting r3 to one. Setting it to zero might be more logical, but this won't update the status register that is required for the zero comparison check.
(gdb) set $r3 = 1
(gdb) info reg r3
r3             0x1      1
(gdb)
The last instruction was the nop assembly code, next is the for loop check, so let's see how the execution goes after that.
(gdb) si
66                      for (i = 0; i < 200000; i++)    /* Wait a bit. */
(gdb)
0x08000178      66                      for (i = 0; i < 200000; i++)    /* Wait a bit. */
(gdb)
0x0800017a      66                      for (i = 0; i < 200000; i++)    /* Wait a bit. */
(gdb)
65                      gpio_toggle(GPIOC, GPIO13);     /* LED on/off */
(gdb)
0x0800016a      65                      gpio_toggle(GPIOC, GPIO13);     /* LED on/off */
(gdb)
0x0800016e      65                      gpio_toggle(GPIOC, GPIO13);     /* LED on/off */
(gdb)
gpio_toggle (gpioport=gpioport@entry=1073811456, gpios=gpios@entry=8192) at ../common/gpio_common_all.c:88
88              uint32_t port = GPIO_ODR(gpioport);
(gdb)
89              GPIO_BSRR(gpioport) = ((port & gpios) << 16) | (~port & gpios);
(gdb)
0x080001ee      89              GPIO_BSRR(gpioport) = ((port & gpios) << 16) | (~port & gpios);
(gdb)
0x080001f0      89              GPIO_BSRR(gpioport) = ((port & gpios) << 16) | (~port & gpios);
(gdb)
0x080001f4      89              GPIO_BSRR(gpioport) = ((port & gpios) << 16) | (~port & gpios);
(gdb)
0x080001f6      89              GPIO_BSRR(gpioport) = ((port & gpios) << 16) | (~port & gpios);
(gdb)
At this point the LED will turn off (or back on).
The duplicate source code lines shown here are caused by C code simply using multiple assembly instructions. To see what's happening deeper, check the disassemble (disas) command to, eh, disassemble the code. Which, by the way, would have instantly shown that register r3 is indeed used to store the loop counter. Oh well..
But let's say we want to avoid the register r3 manipulation all together and instead force the program counter register pc straight to the gpio_toggle() function. As we can see from the output above, the gpio_toggle() call happens around address 0x0800016a, so let's see what we got there. It will actually display data for the whole function the memory address is part of, in this case main(), so let's focus on the interesting part. Note, using /m will display the C code next to it, see help disas for more info.
(gdb) disas /m 0x0800016a
...
65                      gpio_toggle(GPIOC, GPIO13);     /* LED on/off */
   0x08000168 <+24>:    ldr     r0, [pc, #16]   ; (0x800017c <main+44>)
   0x0800016a <+26>:    mov.w   r1, #8192       ; 0x2000
   0x0800016e <+30>:    bl      0x80001e8 <gpio_toggle>
   0x08000172 <+34>:    ldr     r3, [pc, #12]   ; (0x8000180 <main+48>)
...
(gdb)
The actual branch call to gpio_toggle() is at address 0x0800016e, but setting the program counter to that address won't do anything to the LED, since the LED port itself is given as parameter. The parameter is set in 0x800016a (I didn't look too deep into it, I would expect two parameters to be loaded, but that's not the case). Here we go:
(gdb) set $pc = 0x800016a
(gdb) si
0x0800016e      65                      gpio_toggle(GPIOC, GPIO13);     /* LED on/off */
(gdb)
gpio_toggle (gpioport=gpioport@entry=1073811456, gpios=gpios@entry=8192) at ../common/gpio_common_all.c:88
88              uint32_t port = GPIO_ODR(gpioport);
(gdb)
89              GPIO_BSRR(gpioport) = ((port & gpios) << 16) | (~port & gpios);
(gdb)
0x080001ee      89              GPIO_BSRR(gpioport) = ((port & gpios) << 16) | (~port & gpios);
(gdb)
0x080001f0      89              GPIO_BSRR(gpioport) = ((port & gpios) << 16) | (~port & gpios);
(gdb)
0x080001f4      89              GPIO_BSRR(gpioport) = ((port & gpios) << 16) | (~port & gpios);
(gdb)
0x080001f6      89              GPIO_BSRR(gpioport) = ((port & gpios) << 16) | (~port & gpios);
(gdb)
Yep, LED goes on/off here. Doing this multiple times in a row will always toggle the LED, so feel free to actually try it with 0x0800016e as program counter value to see, nothing will happen in that case. And if you keep on stepping the single instruction, it will always return to the counter. Of course, with such a simple program, there aren't too many side effects. Things will be different in a more complex program (especially with code size optimization, I could assume), so careful with wildly writing into registers.
Last words
Phew, what a journey. But well, while in the end, all we got was a blinking LED (which we already had as default program on the board), all the main parts that are needed to continue from here were basically covered, and I hope this was a good start for further explorations.
Continuing from here
Yeah, don't worry, nothing will continue in this article anymore. As for myself, I will continue with libopencm3 and their examples for a while, maybe starting with SPI or UART. I know I will reach the library's limits eventually and have to get to vendor specific implementations and meet the Cortex Microcontroller Software Interface Standard (CMSIS), which I purposely haven't even mentioned here.